 Blog Post
Following a Vulnerability Through the Supply Chain
Inside RESCALE’s Graph Application
Finding a vulnerability is only the first step in understanding supply-chain risk. Once a vulnerable package has been identified, organisations still need to determine which products contain it, which components depend on those products, and how far the impact may spread. This becomes difficult when software is assembled through several layers of direct and indirect dependencies. A single library may be included in many products, while those products may themselves become dependencies of larger systems. Searching manually through a large collection of Bills of Materials can take valuable time and may still fail to reveal the complete picture.
RESCALE’s Supply Chain Vulnerability Graph Application was developed to make these relationships easier to explore. It connects component, dependency, vulnerability, and TBOM information in a graph, allowing users to move from one vulnerable package to the wider set of supply-chain elements that may be affected.
Looking at Dependencies in the Opposite Direction
A conventional SBOM tells us which packages are included in a product. For example, it may show that Product A depends on Library B. This information is essential, but during a vulnerability investigation the security team usually needs to ask the question in reverse: which products depend on Library B?
The Graph Application begins with the Package URL, or PURL, of the component under investigation. It identifies the BOMs that directly depend on that component and then continues through additional levels to find products that depend on those BOMs.
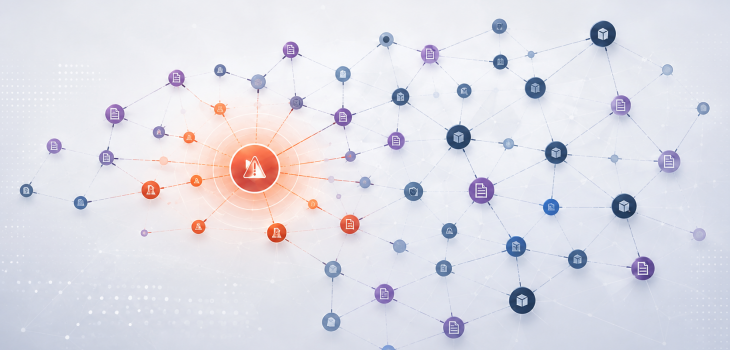
The results are organised as a layered reverse-dependency view. The starting component appears at the first level, followed by its direct dependants and then by components further downstream. Each result can include information such as the component PURL, BOM reference, dependencies, associated vulnerabilities, and related TBOM serial number. This makes it easier to estimate the potential blast radius of a newly disclosed vulnerability. Instead of receiving a list of disconnected matches, the analyst can see how the affected component sits within a larger chain of products and dependencies.
Connecting Evidence That Would Otherwise Remain Separate
The Graph Application combines information from several types of RESCALE artefacts. These can include Software and Hardware Bills of Materials, Trusted Bills of Materials, Bills of Vulnerabilities, and the guarantees produced through static and dynamic testing. The information is converted into a connected graph model. Components, vulnerabilities, serial numbers, and external references become graph entities, while relationships describe dependencies, ownership, vulnerability links, and membership in a wider trusted record.
This approach preserves the context around each piece of evidence. A vulnerability is connected to the component it affects, the component is linked to the BOM that identifies it, and the assessment evidence remains associated with the relevant TBOM and version. The application is implemented as a Python service backed by a Neo4j graph database. This allows it to answer questions that are difficult to address through isolated JSON documents, especially when the analysis must follow several levels of dependency relationships.
Viewing the Evidence Around a TBOM
The application also introduces the concept of a TBOM component island. A component island groups the documents and graph elements associated with one trusted supply-chain context.
The TBOM serial number acts as the starting point. From there, the application can retrieve the associated SBOM, vulnerability information, component relationships, external references, and available static or dynamic assessment evidence. This consolidated view is useful for analysts and auditors who need to understand why a particular security status was assigned. Instead of opening several documents separately and trying to match their identifiers manually, the user can inspect their relationships through one connected model.
The graph also makes incomplete evidence visible. An SBOM may reference a dependency for which no separate BOM has yet been uploaded. In this case, the application can preserve a placeholder node rather than hiding the relationship. When the missing document becomes available, the placeholder can be updated with the complete information. Lifecycle changes can be represented in the same way. Deprecated components can be excluded from an operational view or included when the user needs to examine historical dependencies and earlier product versions.
Supporting Faster and More Focused Decisions
The Graph Application turns supply-chain documentation into a resource for practical investigation. Security teams can identify the products that may be affected by a newly disclosed vulnerability. Product owners can see which trusted records require review, while auditors can trace the connection between a component, its assessment evidence, and its vulnerability state. The graph also improves communication between organisations. Instead of reporting only that a package contains a vulnerability, a partner can show which products depend on it, how those dependencies were identified, and which TBOMs may be affected.
Modern software supply chains are networks, not simple lists. By connecting RESCALE artefacts and supporting reverse-dependency analysis, the Supply Chain Vulnerability Graph Application provides a clearer way to understand how risk can move through those networks.